We analyzed more than 27,000 trade ideas from over 1,700 market commentators across Substack, Reddit, YouTube, and X. The goal was simple: find out whether market commentary actually generates alpha or merely sounds convincing in hindsight.
Methodology
For each idea, we identified the first time a commentator made a clear directional statement about a ticker. For example, they might state that they were strongly bullish or bearish, disclose that they had bought or shorted the stock, or announce that they had opened a position.
We used the market price at that moment as the entry price.
We then measured the direction-adjusted return at three horizons:
- 5 trading days;
- 20 trading days;
- the full life of the position.
For the lifetime measurement, the position ended when the commentator explicitly closed it. If no closing statement was available, we marked the position to market at the end of the study.
We also compared each result with the S&P 500 over exactly the same dates. That distinction matters: a profitable idea is not necessarily alpha.
Research window: January 2–August 4, 2026, covering 147 trading days.
Most long ideas failed to beat the market
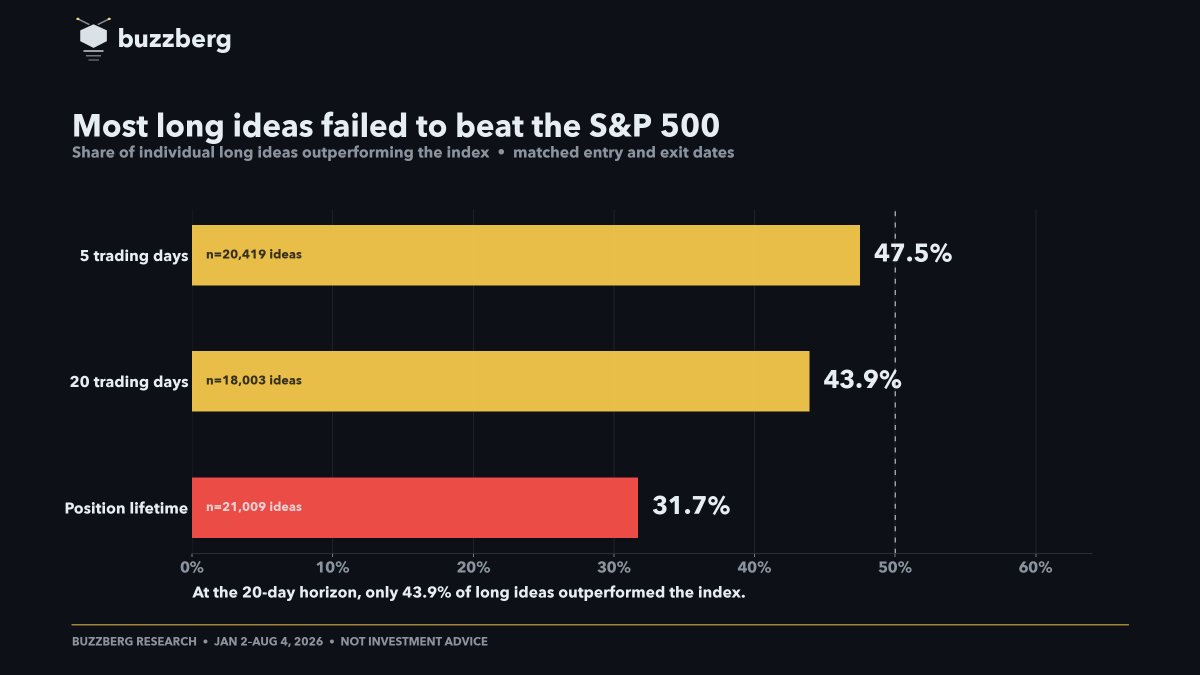
At the individual-idea level, the share of long ideas that outperformed the S&P 500 was:
- 47.5% after 5 trading days;
- 43.9% after 20 trading days;
- 31.7% over the full life of the position.
This is not the same as a win rate. An author can have fewer winning ideas than losing ones and still produce a positive average return if one large winner outweighs several small losses.
The more relevant conclusion is that most individual long ideas did not beat the market. Whatever short-term edge existed rarely persisted without a disciplined exit.
How many commentators beat the S&P 500, and how many beat Jim Cramer?
The long-only results above measure individual ideas. To compare commentators with Jim Cramer on equal terms, we ran a separate author-level test using all directional ideas and included only commentators with at least six evaluable ideas at each horizon.
“Beat the S&P 500” means that a commentator’s average direction-adjusted return relative to the index was positive. “Beat Jim Cramer” means that the same average was higher than Cramer’s result at that horizon.
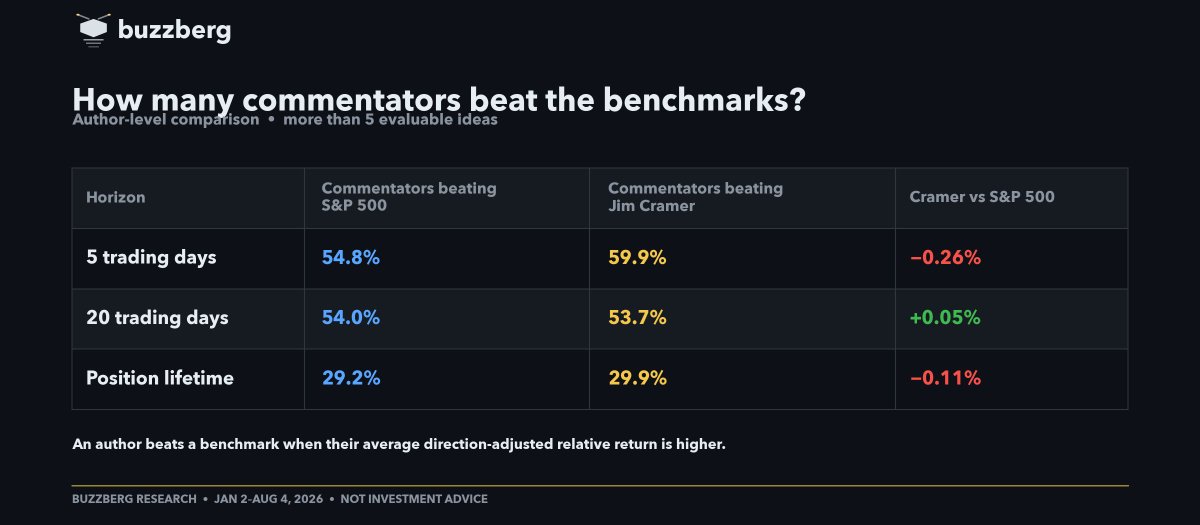
At the shorter horizons, Cramer ranked near the median among eligible commentators. After five days, 59.9% of eligible commentators beat him; after 20 days, 53.7% did.
The lifetime result is more surprising. Only 29.9% of eligible commentators beat Cramer, meaning that he outperformed 70.1% of them. However, Cramer’s own average relative return was still −0.11%.
This may partly reflect the measurement method rather than a complete absence of signal in commentators’ ideas. Many public calls are short-term and tactical, whereas our lifetime test kept a position open until the commentator explicitly closed it, or until the end of the study if no clear exit was published. A good tactical call could therefore produce a weak lifetime result simply because the position remained open in our data.
The average long barely moved but still lost to the market
The S&P 500 returned +12.90% over the full research window from January 2 to August 4, 2026.
But each idea began on a different date. We therefore compared each idea with the index over its own matching entry and exit dates. The S&P 500 numbers below are the average index returns over those matched windows, not the index’s return over the full study period.
After 20 trading days, the average long returned just +0.10%, while the S&P 500 returned an average of +0.62% over the same windows. The long ideas therefore had an average relative return of −0.52%.
The same pattern appeared at every horizon:
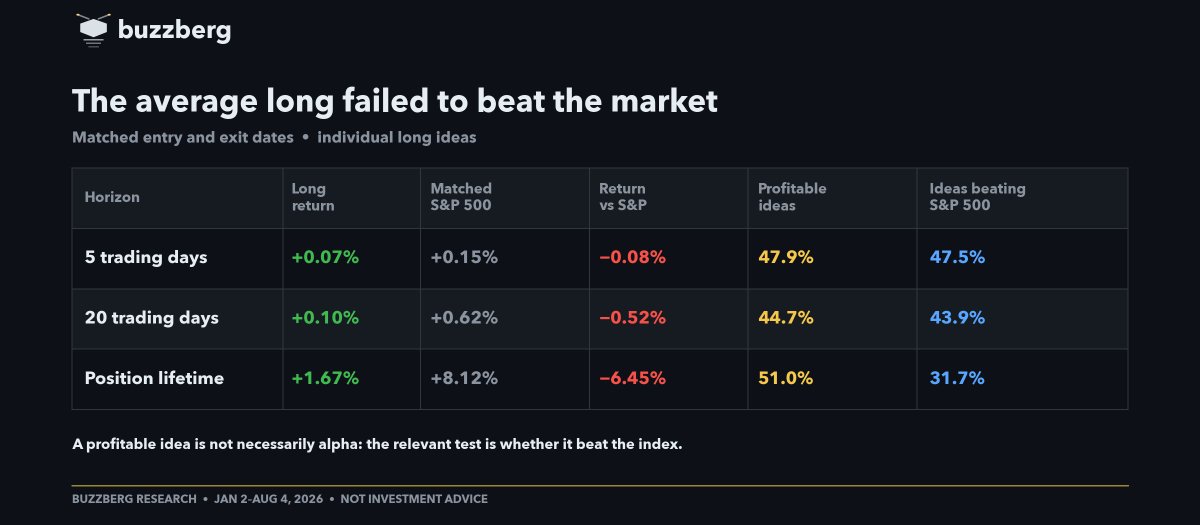
The average long made money over its full lifetime, but the market made far more.
This is why raw returns are a poor way to judge financial commentary. In a rising market, almost anyone can occasionally publish a profitable idea. The relevant question is whether the idea outperformed the alternative of simply holding the index.
Shorts were better at finding relative weakness
Short ideas produced a different pattern.
For shorts, “return versus the S&P 500” measures whether the targeted stock underperformed the index. For example, after 20 trading days, the average targeted stock fell by 0.06% while the S&P 500 gained 1.31%.
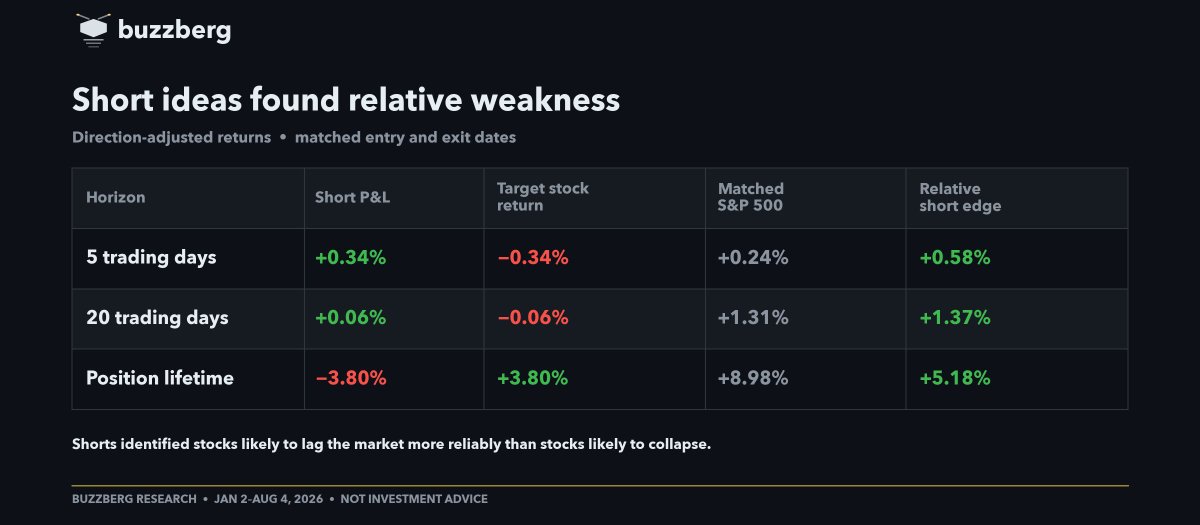
After 20 trading days, the average short position was roughly flat in absolute terms but produced an average relative return of +1.37%.
Over the full position lifetime, shorts lost money in absolute terms but still produced an average relative return of +5.18%.
That means bearish commentators were better at identifying stocks likely to lag the market than stocks likely to collapse.
Where was the alpha: on X, YouTube, Reddit, or Substack?
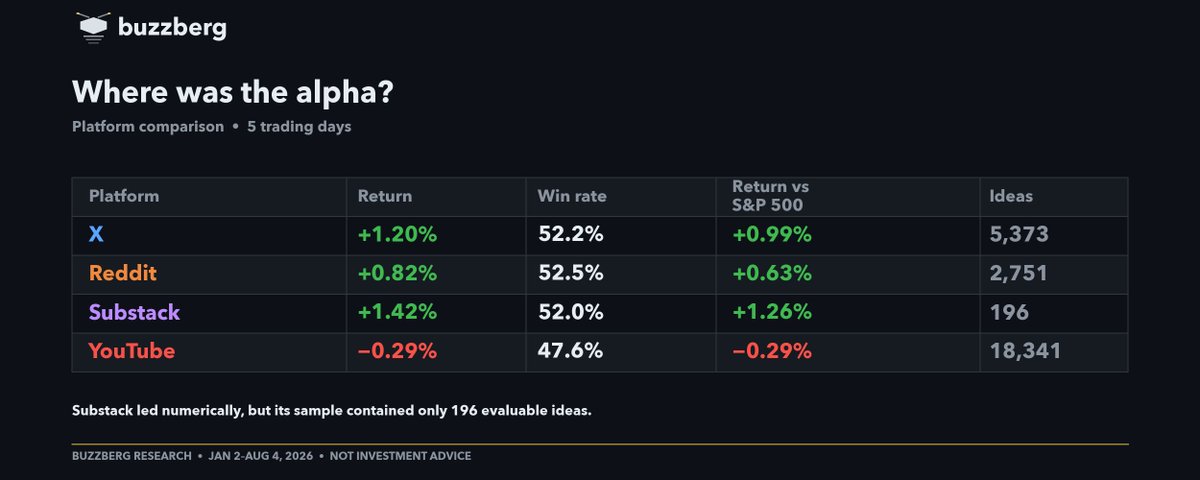
Here is the full comparison across all three horizons:
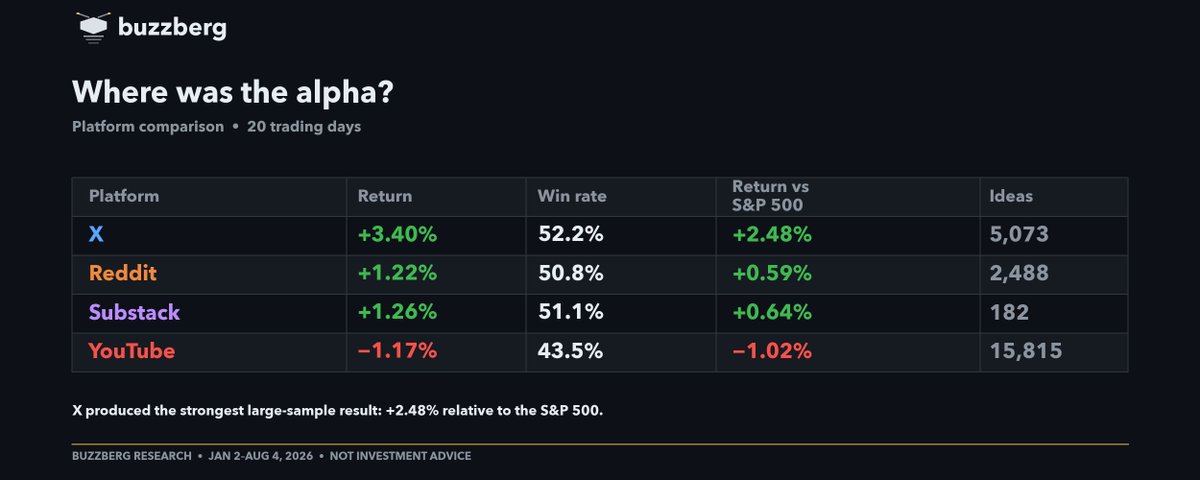
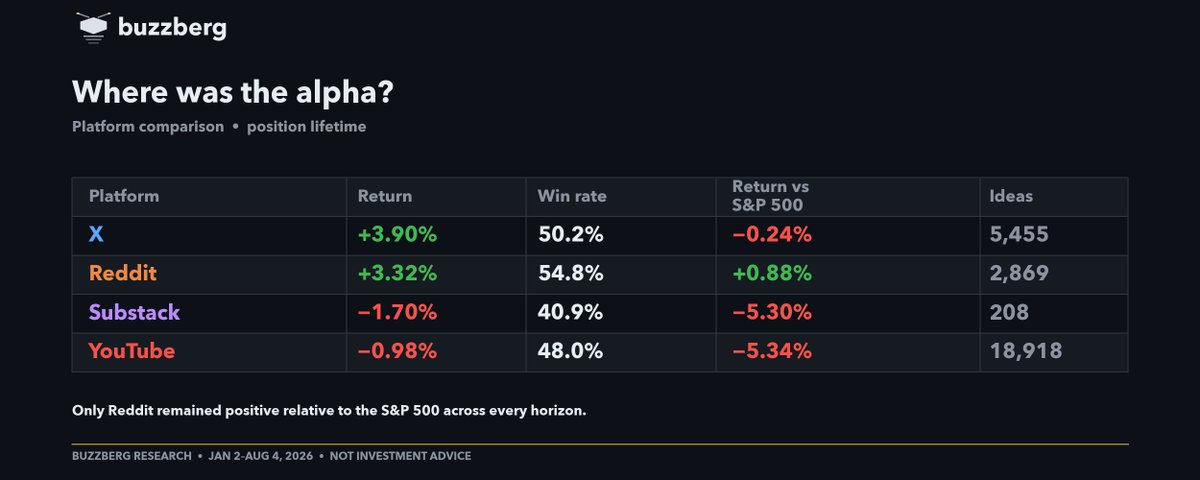
X produced the strongest fixed 20-day result in the sample: +3.40% in absolute return and +2.48% relative to the S&P 500. The average X idea remained profitable over the full position lifetime, but that average slightly trailed the index over the corresponding matched windows.
Reddit was the only major platform with positive relative returns across all three horizons. Over their full lifetime, Reddit ideas returned +3.32%, outperforming the index by 0.88% on average.
YouTube was negative relative to the market at every horizon. The result was weakest over the full position lifetime, where YouTube ideas lagged the index by 5.34% across almost 19,000 observations.
Substack produced positive relative returns at the 5- and 20-day horizons, but its sample was too small to support a firm platform-level conclusion. Its lifetime result was negative, although only 208 ideas were evaluable.
What happened inside YouTube?
The average YouTube idea underperformed the S&P 500:
- −0.29% after 5 trading days;
- −1.02% after 20 trading days;
- −5.34% over the full life of the position.
But the aggregate result masked enormous differences between channels.
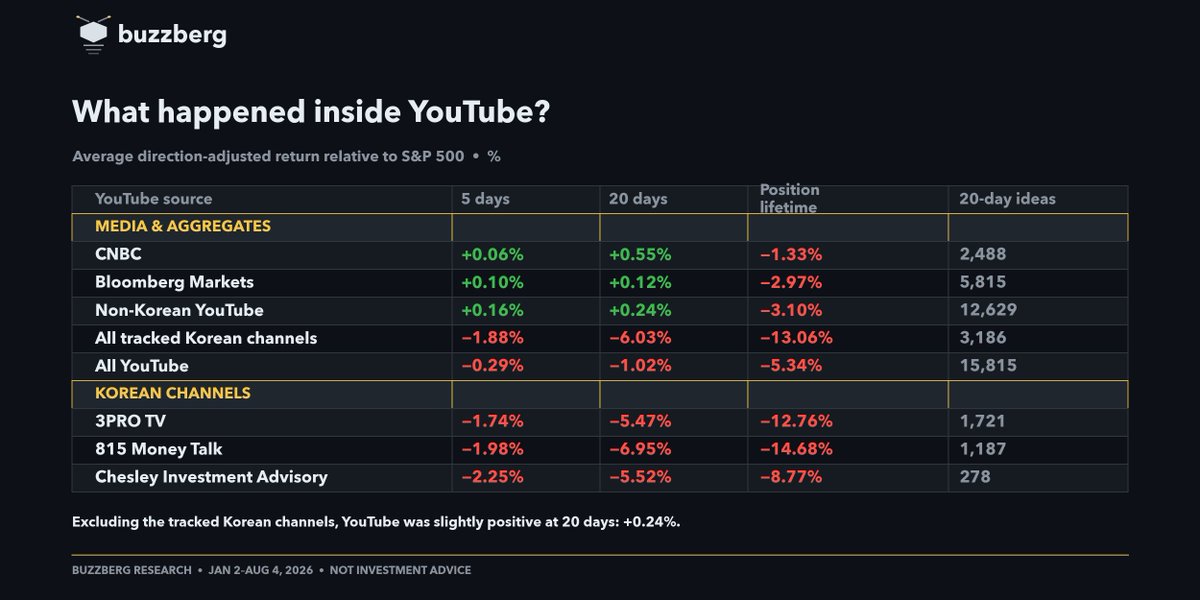
At the 20-day horizon:
- CNBC: +0.55% vs S&P 500
- Bloomberg Markets: +0.12%
- All tracked Korean channels: −6.03%
- YouTube overall: −1.02%
The tracked Korean channels accounted for much of YouTube’s overall underperformance. Excluding them, YouTube’s 20-day relative return was slightly positive.
Podcast results were even more dispersed.
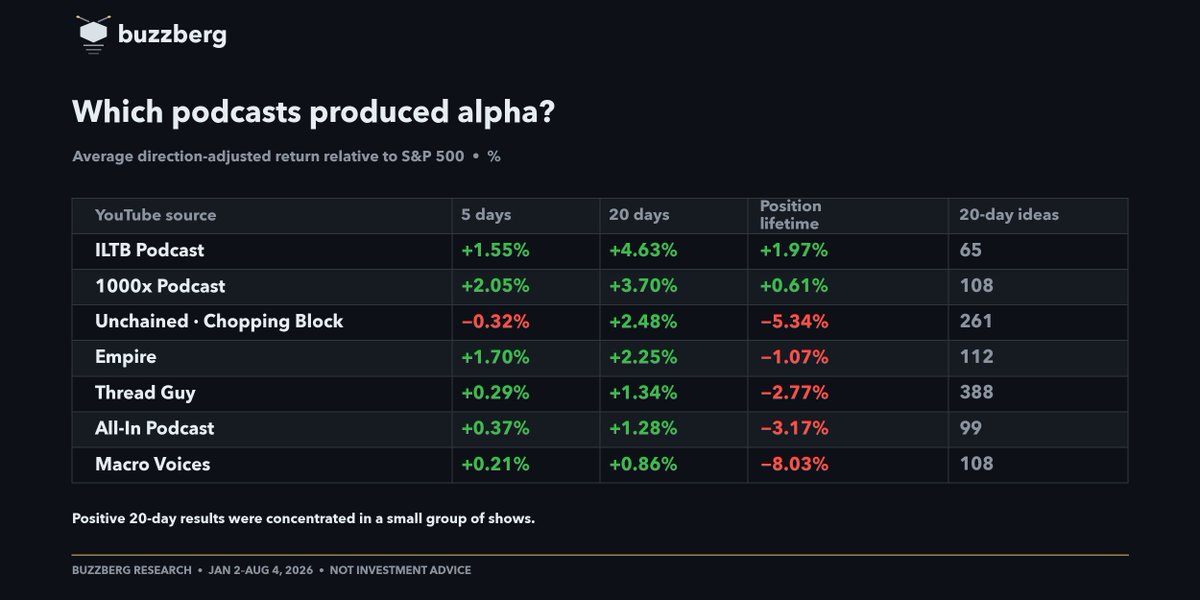
The strongest 20-day results included:
- ILTB Podcast: +4.63%
- 1000x Podcast: +3.70%
- Unchained’s Chopping Block: +2.48%
- Empire: +2.25%
- Thread Guy: +1.34%
- All-In Podcast: +1.28%
The takeaway
Beating the S&P 500 is supposed to be difficult. Our data confirms it.
Most individual long ideas failed to beat the index. At the lifetime horizon, only 31.7% of long ideas outperformed the S&P 500. Among commentators with at least six evaluable long ideas, only 21.2% posted a positive average relative return.
The practical takeaway: don’t hold a commentator’s bag indefinitely. Even when a call initially generates alpha, that edge often fades with time. If the author never publishes an exit, that is not a reason to keep holding the position forever.
That does not mean financial commentary has no value. It means following everyone is not a strategy.
The useful signal comes from selecting the relatively small group of commentators who have demonstrated persistent outperformance across a sufficient number of ideas and multiple time horizons. A persuasive explanation is not enough; the track record has to survive measurement.
That is why we are building Buzzberg: to measure the performance behind each opinion and separate repeatable signal from confident noise.
Look beyond the opinion
Explore the commentators and investment ideas tracked by Buzzberg.
Explore expert profiles