

CNBC and Bloomberg put out market clips all day. A guest names a stock, the clip gets shared, and months later the winning call is easy to remember. What happens if we count the ordinary calls too?
Buzzberg tracked 15,217 videos published from January 1 through November 7, 2026, by CNBC and Bloomberg Markets. We analyzed 14,870 of them and recorded 23,206 long or short mentions of stocks, ETFs, funds and crypto. For this comparison, we tested attributable positive views on individual stocks that we could price. Each stock and SPY, an S&P 500 ETF, entered and exited on the same dates.
The 90-day averages favor CNBC and not Bloomberg. But the CNBC result changes when repeated calls by the same speaker are counted once.
What happened to $100 after 90 days?
Imagine putting $100 into a stock at the next available daily close after the video appeared. Put another $100 into SPY at that same close, then check both 90 days later.
Across 3,905 CNBC stock observations, the average $100 became $105.15. The matching SPY investments became $104.16. Across 3,191 Bloomberg Markets observations, the stock became $103.20, while SPY became $105.09.
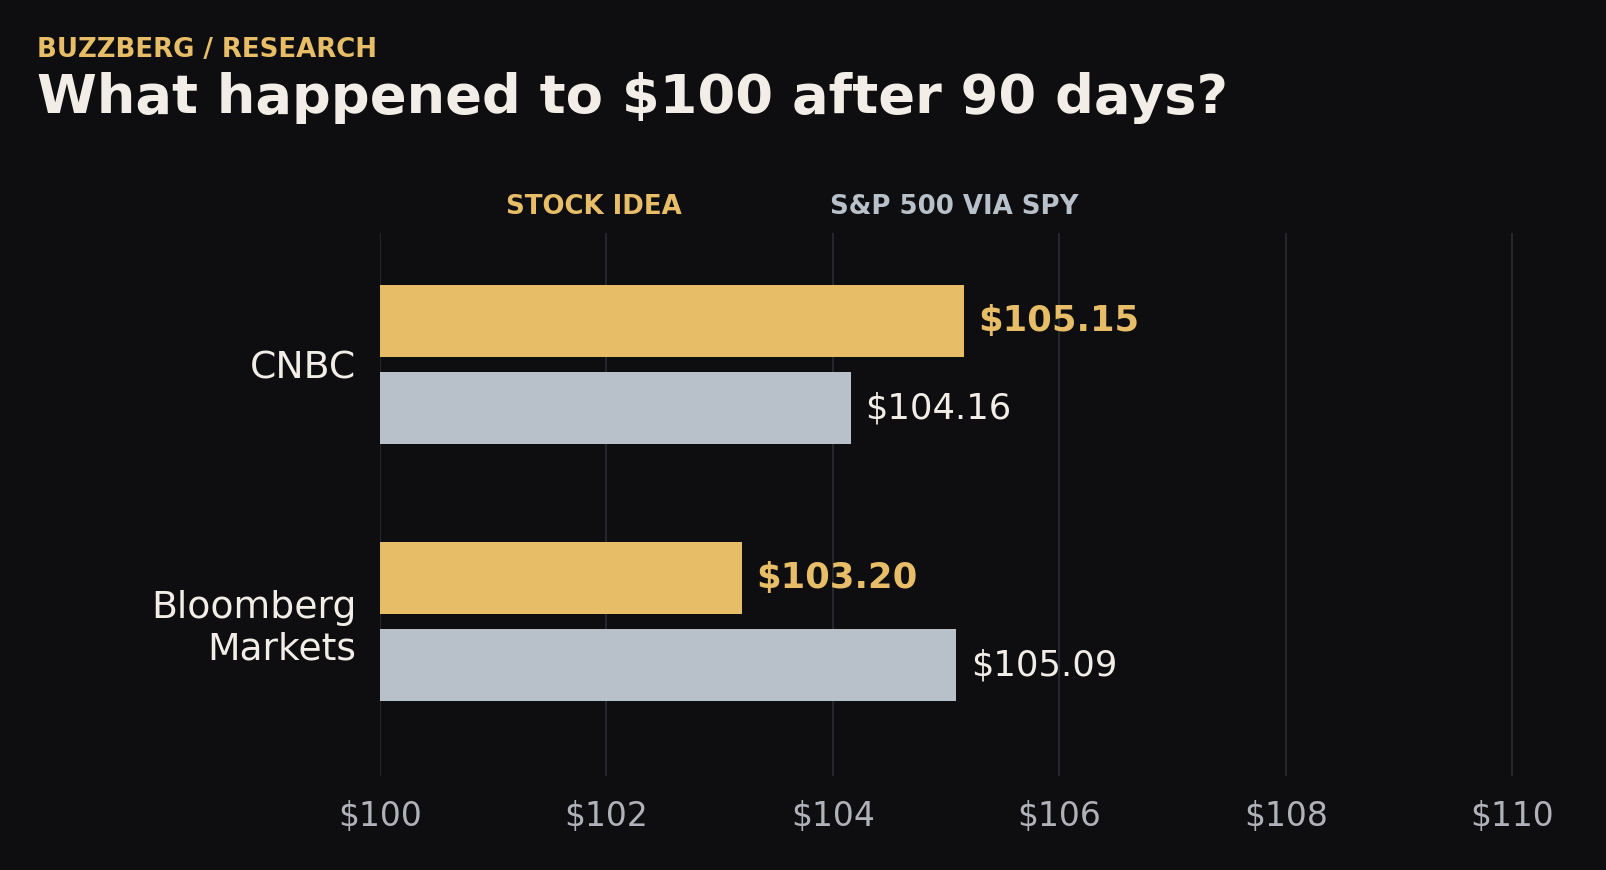
A video about five stocks can contribute five observations. If the same stock is discussed in another video, that is another observation in this first calculation.
Most individual ideas still lost to the index
Only 43.9% of CNBC observations and 38.5% of Bloomberg observations beat their own same-date SPY comparison after 90 days. CNBC's large winners lifted the average, although most individual observations trailed the index. The median Bloomberg stock return was slightly below zero.
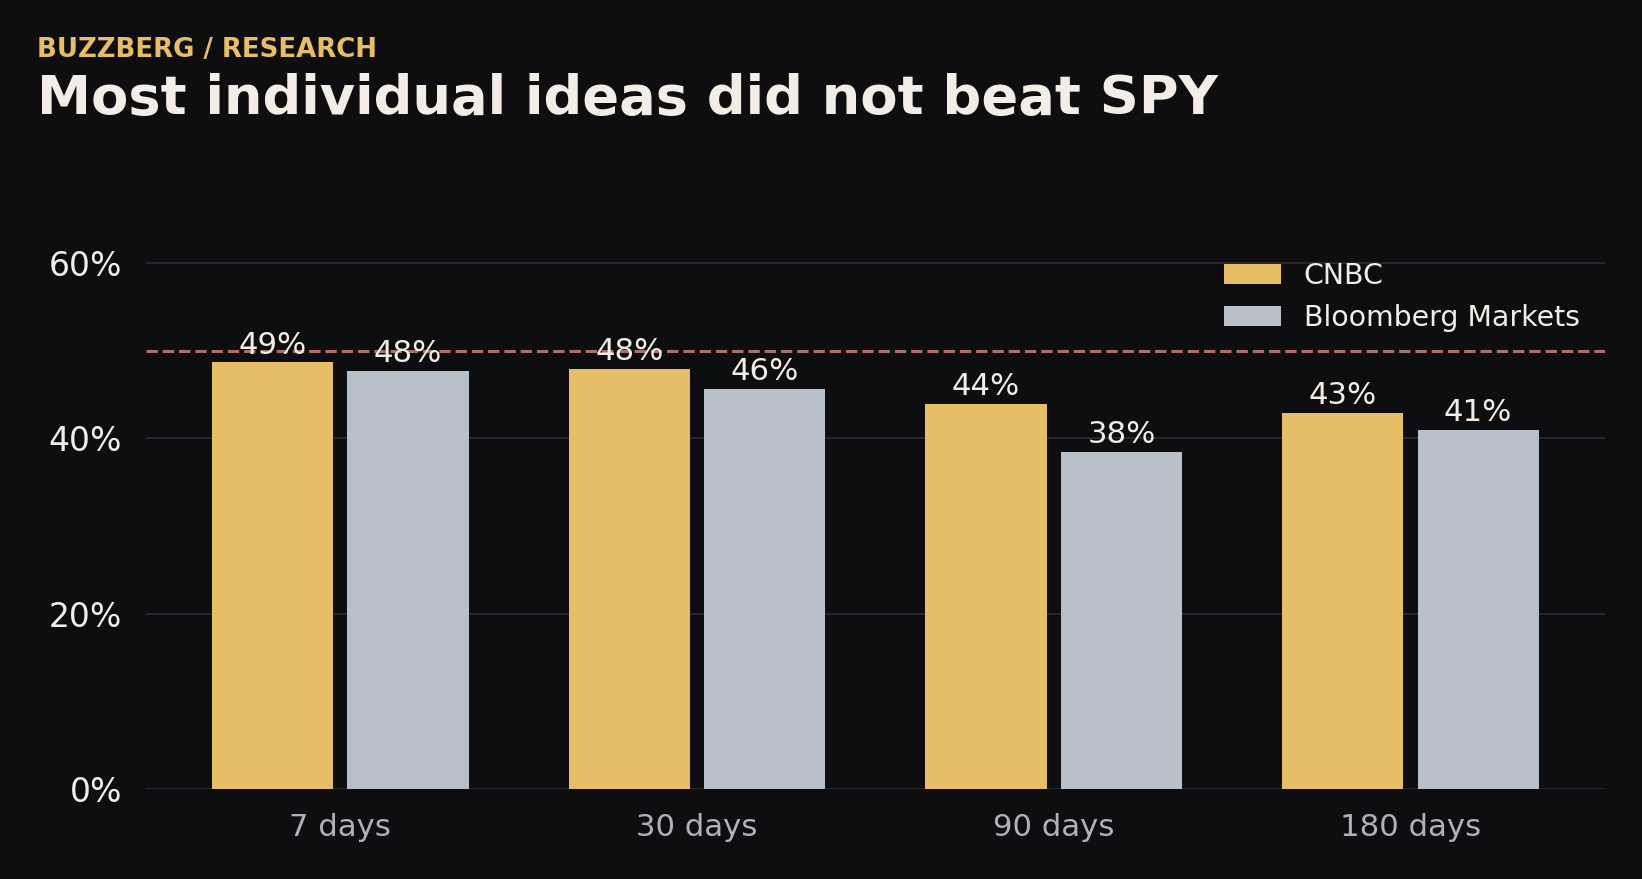
The average answers what happened across the whole set. The hit rate answers a different question: how often an individual idea beat simply buying the index.
The holding period changes the result
| Channel | Holding period | Stock idea | SPY on same dates | Priced observations |
|---|---|---|---|---|
| CNBC | 7 days | +0.10% | +0.08% | 5,014 |
| CNBC | 30 days | +0.79% | +0.49% | 4,810 |
| CNBC | 90 days | +5.15% | +4.16% | 3,905 |
| CNBC | 180 days | +15.01% | +10.06% | 2,867 |
| Bloomberg Markets | 7 days | −0.13% | −0.10% | 4,415 |
| Bloomberg Markets | 30 days | −0.35% | +0.13% | 4,277 |
| Bloomberg Markets | 90 days | +3.20% | +5.09% | 3,191 |
| Bloomberg Markets | 180 days | +11.64% | +10.85% | 2,005 |
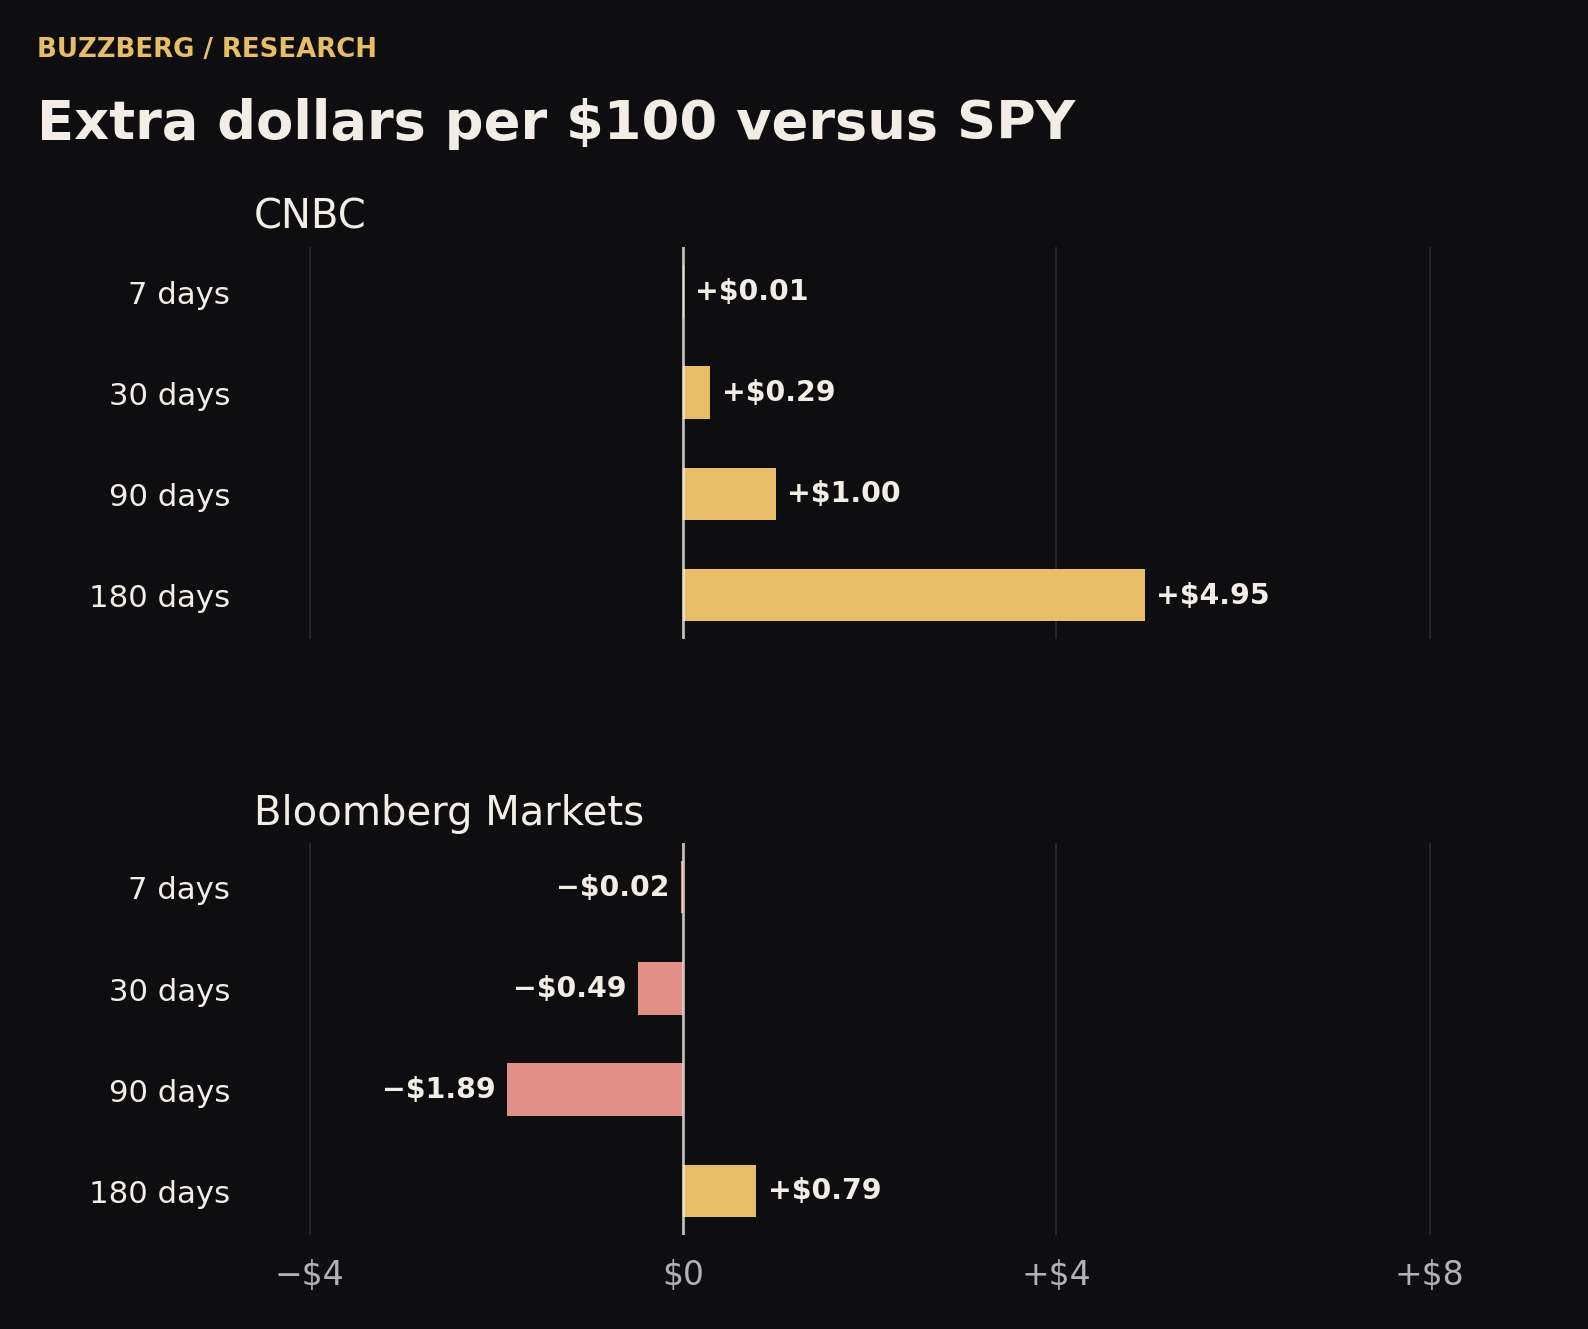
The rows do not follow one fixed group of stocks. A 7-day result can include recent videos; the completed 90-day set reaches only videos published through August 7. The 180-day set reaches back further still. That matters when market conditions change during the year.
CNBC's lead is sensitive to repeated calls
Jim Cramer appears in 1,858 of CNBC's 3,905 priced 90-day stock observations. Remove those observations and the remaining CNBC average is +3.98%, just below +4.16% for SPY on the same dates.
A concrete example: the full Mad Money episode and a short clip from it both discussed Moderna on the same evening. They produced identical entry dates and 90-day outcomes in our calculation, but count as two observations in the video-level calculation.
There is another way to handle repetition: keep only the first 2026 view on each stock by each named speaker within a channel. CNBC's 90-day average then becomes +3.21% versus +3.84% for SPY. Bloomberg remains behind: +2.91% versus +5.46%.
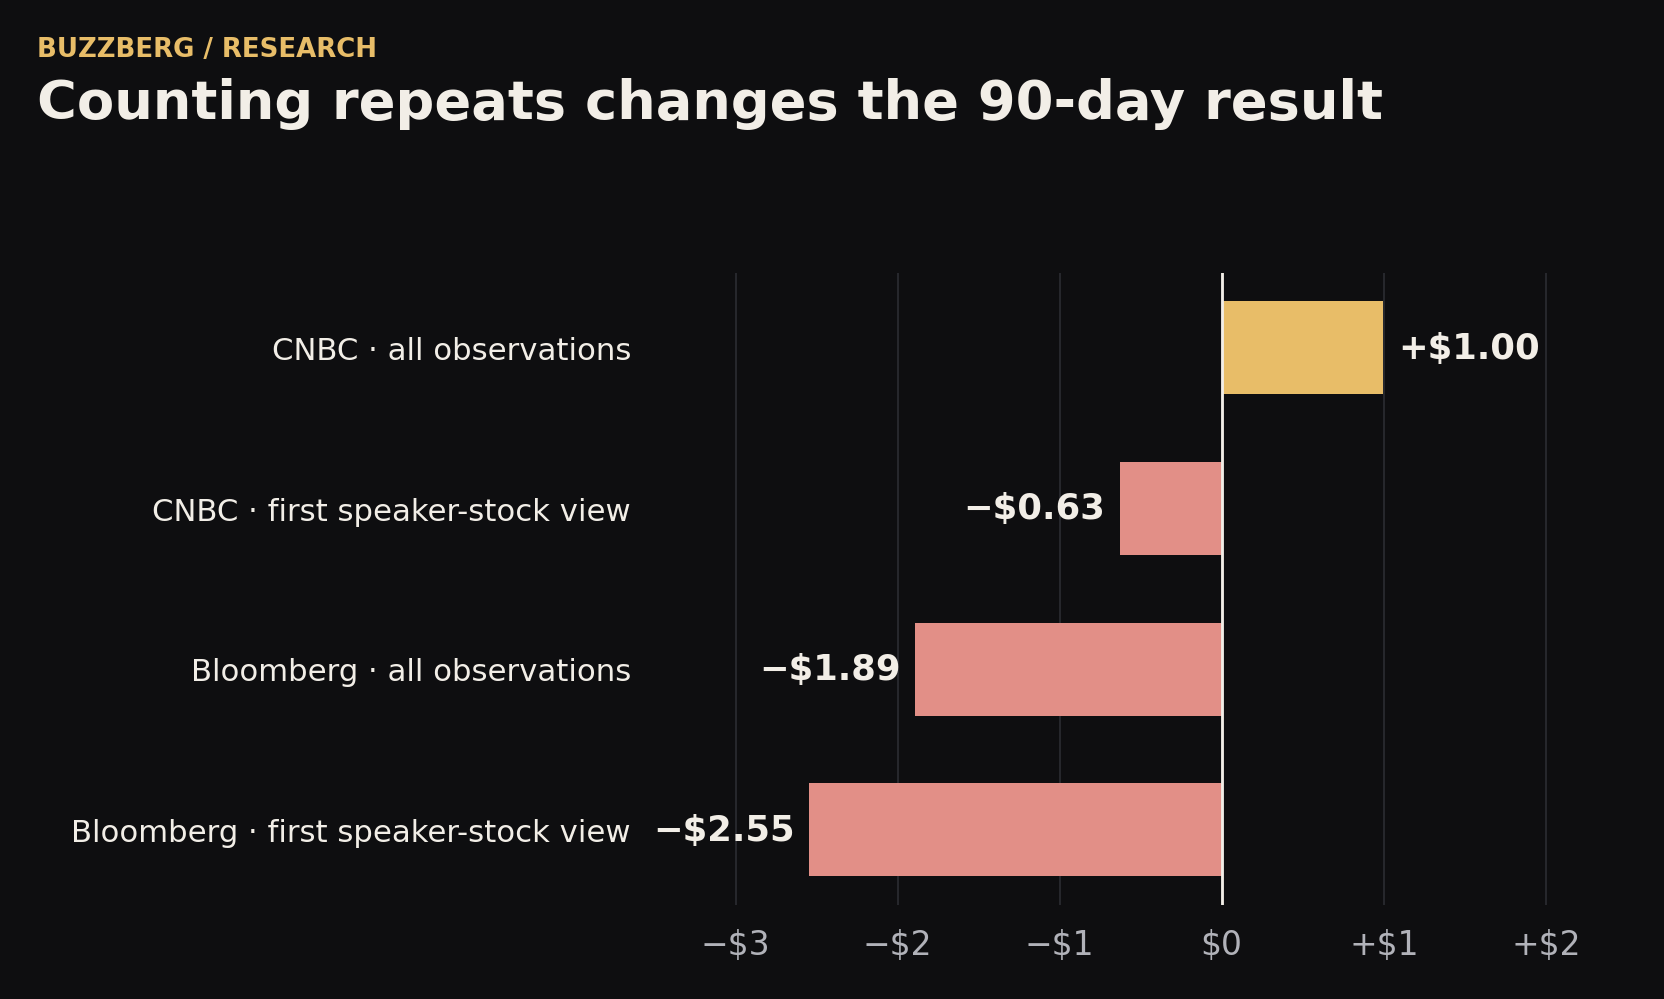
The first-view rule misses useful updates to a thesis, so it is not automatically the better score. But ten clips repeating the same stock view are not ten independent discoveries. Under this rule, CNBC's roughly +$1 per $100 lead becomes a −$0.63 gap.
The early-year CNBC calls did most of the work
For each $100 invested, CNBC stock views published from January through March ended $2.56 ahead of SPY after 90 days. Views from April through June ended $1.88 behind; the eligible July to early-August group ended $0.58 behind. Bloomberg trailed SPY in all three groups.
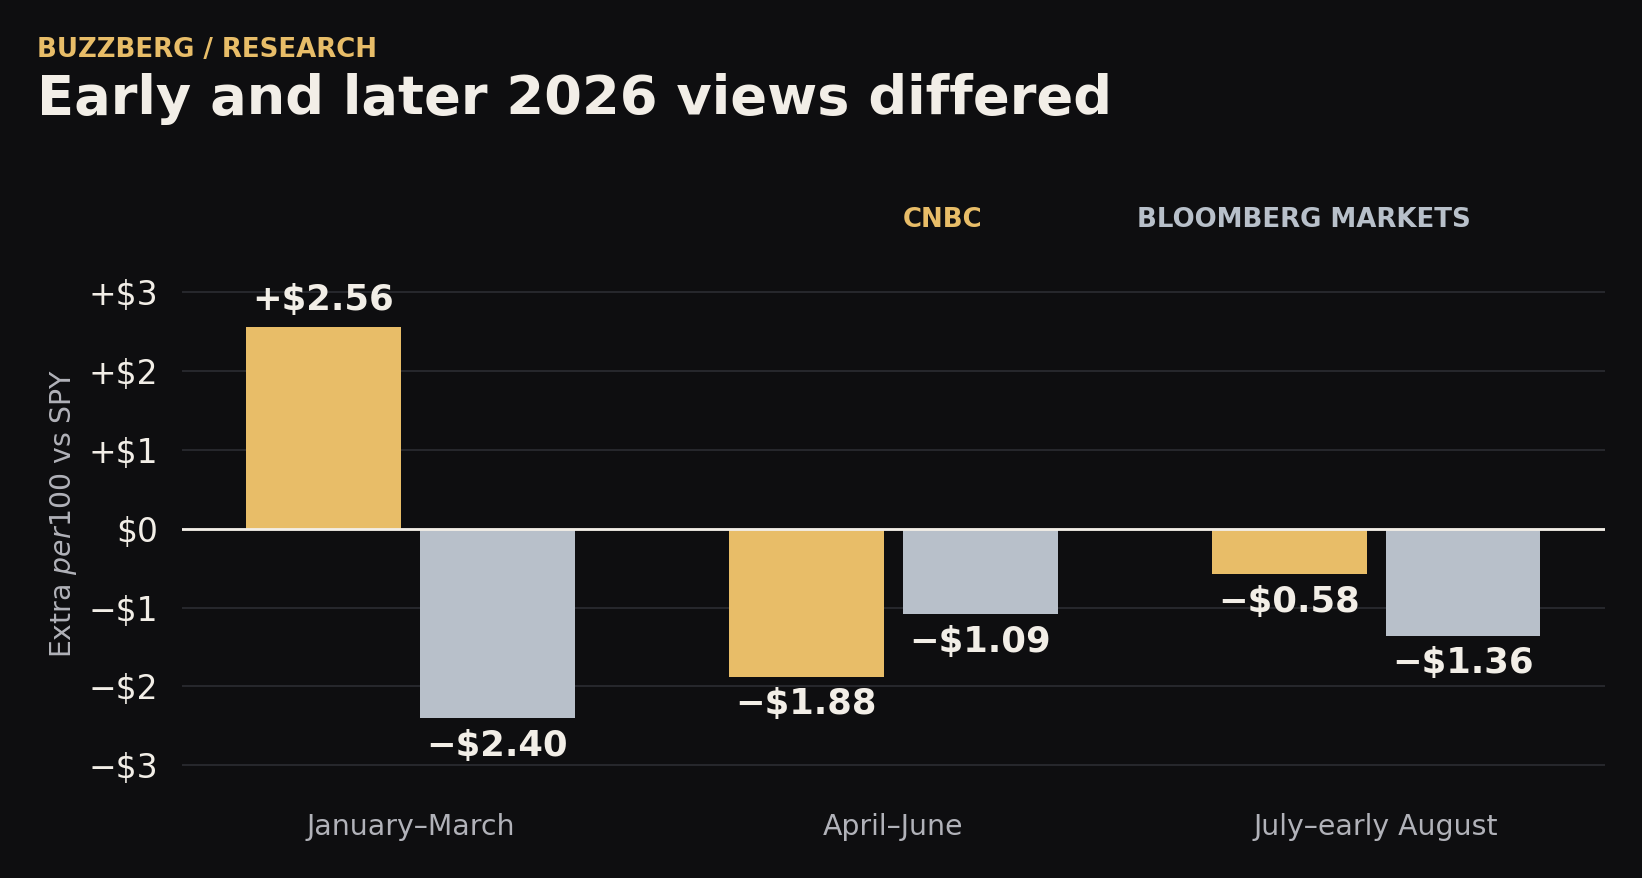
This is why a full-year average can be misleading even before the year ends. It combines calls made in different markets, and the longest holding periods are available only for the oldest calls.
A guest may tell you more than a channel average
The extracted views attributed to Dan Ives are one lead for deeper research. His 90-day CNBC set averaged +15.77% versus +6.53% for SPY across 81 priced stock observations. His Bloomberg set averaged +9.87% versus +4.28% across 118. Yet only 44% and 46%, respectively, beat SPY as individual observations.
His late-February discussions on CNBC and Bloomberg generated multiple stock observations, including AMD and Micron. These are related bets from the same conversations, not independent forecasts. A favorable view of a business is not always an instruction to buy its stock.
Bloomberg's 90-day stock observations trailed SPY in this sample. CNBC's average led, but most of its individual observations did not, and the lead vanished when repeated speaker-stock views were counted once. The next useful question is which guests made distinct, well-timed calls—and which only looked good because the same winner appeared in many clips.