

A stock starts appearing everywhere: in an X thread, a YouTube interview, a Reddit discussion, then a newsletter. Buzzberg tracks those conversations and the companies they mention. By the time the stock reaches your feed, is the attention telling you something useful about the next move—or describing the move that already happened?
We tested that question against our archive through October 16, 2026. The result is less exciting than a “social sentiment beats the market” headline: neither a high bullishness score nor a sudden jump in mentions reliably identified stocks that would outperform.
What we actually tested
The archive contains 256,568 ticker-linked mentions published from January 1 through October 16: 148,967 from X, 81,691 from YouTube, 23,825 from Reddit and 2,085 from newsletters. Those counts include stocks and crypto. The stock-return analysis used 121,679 liquid stock-and-date observations with price coverage.
On each day, we grouped the stocks Buzzberg had recorded from least to most positive, then compared their returns after buying at the next available open. We looked one, three, five, ten and twenty trading sessions ahead. The primary comparison was with other liquid stocks mentioned by Buzzberg on the same dates; we also checked SPY. We counted a post only after Buzzberg recorded it, and excluded posts found more than three days after publication. That way, an old post discovered later cannot appear to predict an earlier move.
Bullishness barely separated the stocks
The most direct measure was the average sentiment of the previous seven days. We compared the most bullish fifth of stocks with the least bullish fifth mentioned on the same date.
Here is how to read the graph: +$1 per $100 means the bullish group finished $1 ahead of the less bullish group for every $100 put into each on the same date. A negative number means it finished behind. These are average differences across many dates, not the balance of a running portfolio.
The average gap across the full sample: after five trading sessions, it was essentially zero (−$0.001 per $100). After twenty sessions, the bullish group was $0.62 ahead per $100. That twenty-session average hid a reversal: the bullish group was $1.62 ahead for signals through May 15 and $0.23 behind for later signals. Each number is the average of same-date group comparisons, not the cumulative return from following the strategy all year.
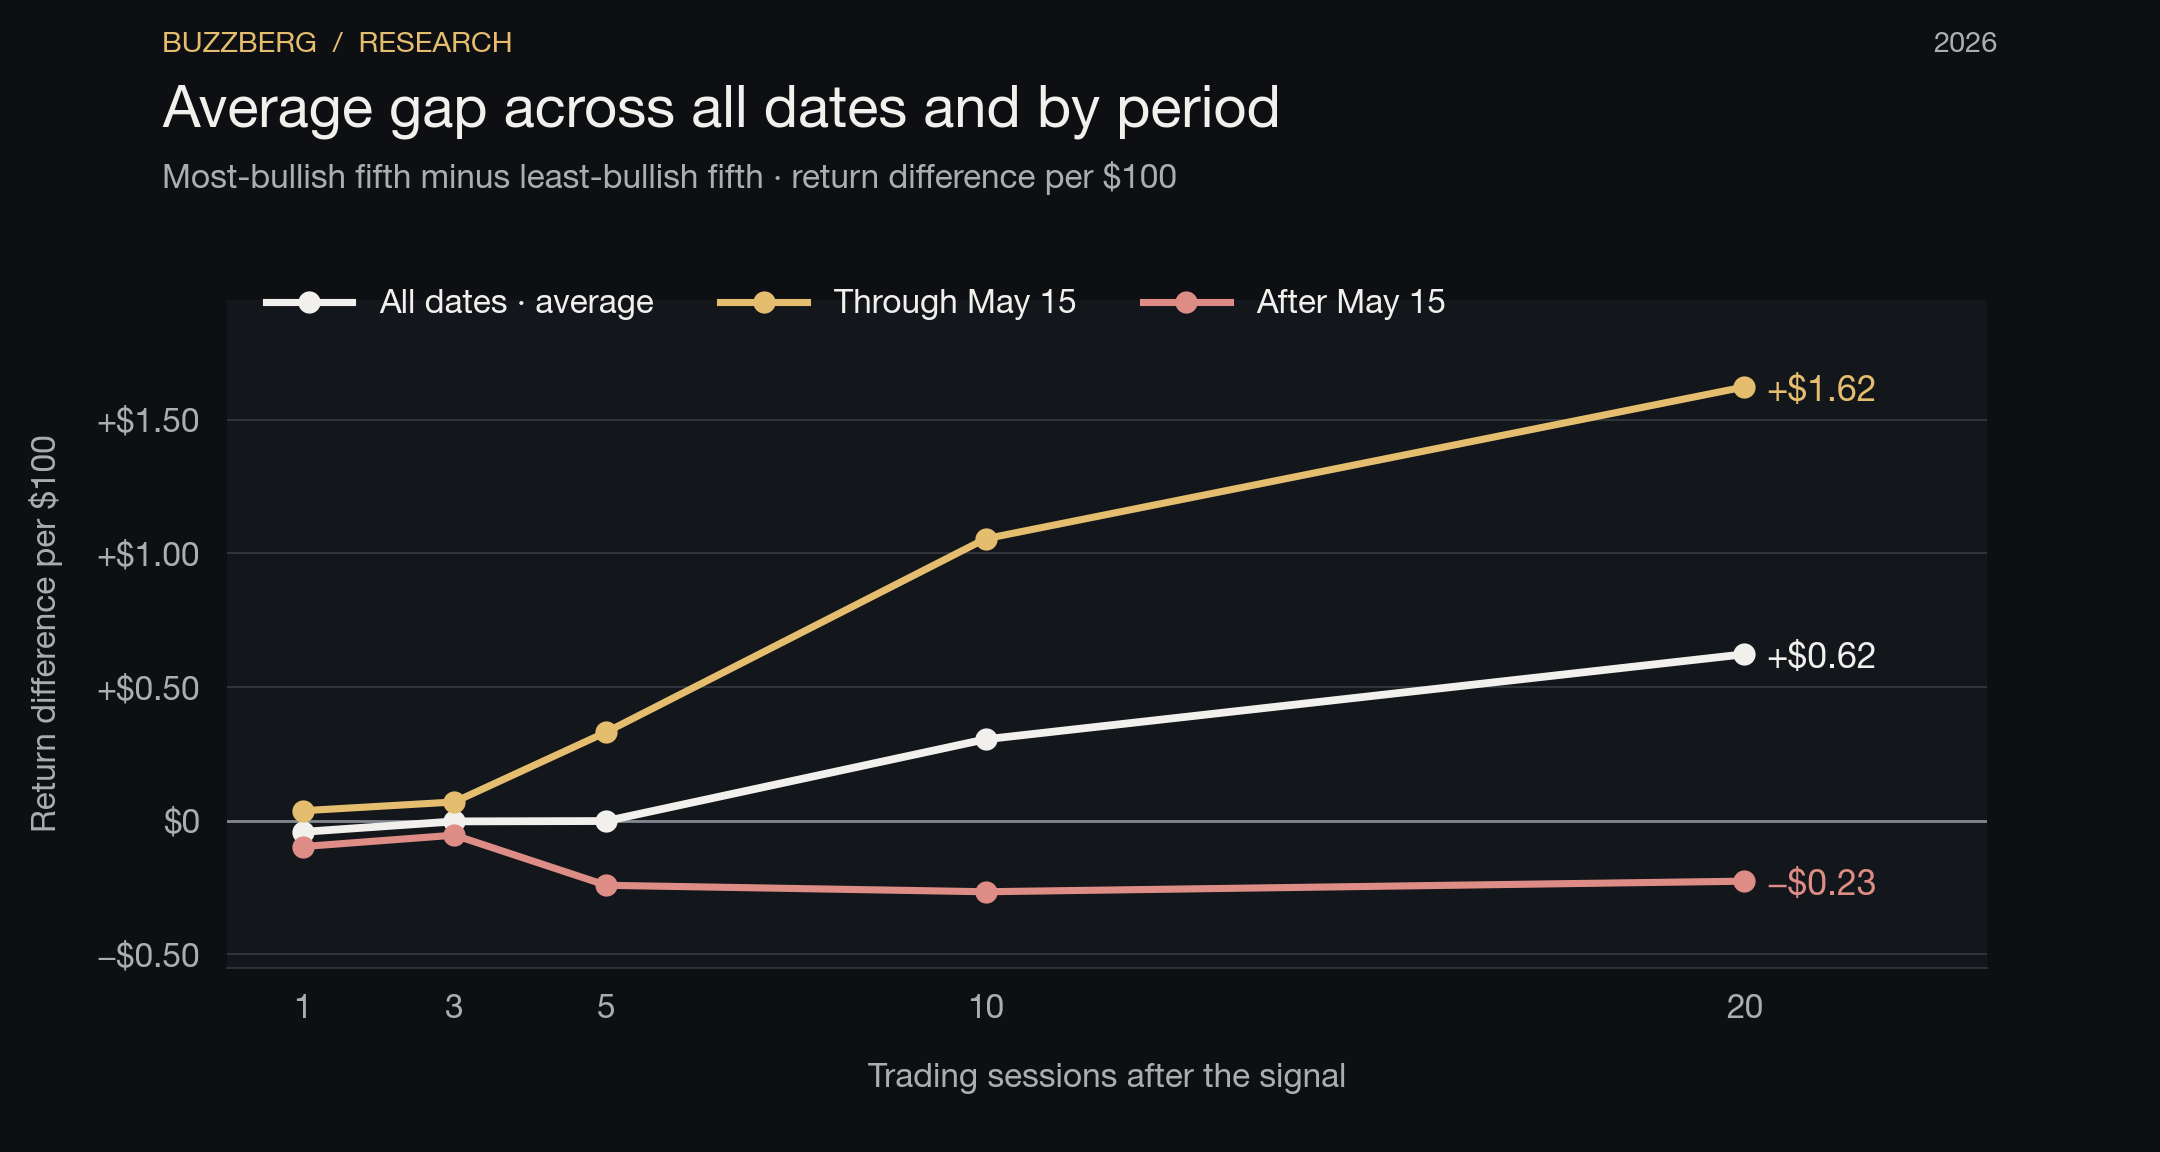
The earlier lead coincided with a technology-led rally. From February 2 to May 15, QQQ rose 13.2% and the semiconductor ETF SMH rose 36.4%, against 6.3% for SPY in our price data. The more bullish stocks also had higher market sensitivity and stronger recent price gains. Comparing stocks within similar themes and accounting for those differences left no clear independent sentiment effect. The rally may have helped the bullish group, but this test cannot say it caused the whole gap.
We tested seven measures at five holding periods. After accounting for those comparisons, the seven-day bullishness result was not statistically convincing. A green sentiment score is useful for seeing how people feel about a stock. This test does not support treating it as a buy signal.
We reran the test using only mentions with a numerical sentiment score. The bullish group finished $0.15 behind per $100 after five sessions. A twenty-session average of $0.52 ahead came from an earlier stretch; in the later stretch it was $0.78 behind. This subset is mostly X and Reddit, because very few YouTube records have a numerical score.
We also tried a faster measure inspired by Context Analytics' S-Factor, giving recent mentions more weight. It did not produce a consistent result. After five sessions, the most bullish stocks finished $0.01 behind per $100 across our sources and $0.19 ahead using X alone. In the later part of the sample, both versions fell behind. These are separate groups of eligible stocks, so the figures are not a direct comparison between platforms or a return from one portfolio.
The attention spike got weaker with more data
An unusual rise in mentions seemed more interesting in our July snapshot. Then, the most talked-about group beat the quietest by 1.15 points over twenty sessions. Extending the same test through October brought that full-period gap down to +0.46 points. In the later part of the history it was −0.02 points.
This is why we wanted to update the result rather than keep quoting July. The earlier pattern did not strengthen when we gave it more observations. At ten sessions in the new run, the attention gap was only +0.13 points. Neither horizon passed the study's multiple-comparison check. The most active group also lagged SPY over matching dates in the twenty-session comparison.
We checked whether a change in bullishness, the share of all mentions, growth in that share, or the number of distinct speakers did better. A recent rise in bullishness actually pointed the other way at ten sessions: the highest group trailed the lowest by 0.62 points. That is a reason to investigate the timing of enthusiasm, not evidence for an “inverse sentiment” strategy. Across the seven primary measures, none met the study's standard for a stable edge.
The next test: calls and authors, not just mood
Our test compresses very different material into a few daily numbers. A detailed long thesis, a clear short call and a passing positive remark should not necessarily carry the same weight. Nor did this test ask whether the author had a strong record on earlier calls. We want to test explicit long and short ideas against matched-date returns, then see whether the author's past results improve the signal. We have not run that study yet.
Other researchers have found predictive information in social data. A study using Twitter, StockTwits and Seeking Alpha found different effects for sentiment and attention; research on firm-specific Twitter sentiment also found information about subsequent returns. Their periods, sources and scoring rules differ from ours. An older study of stock-message-board posts found a clearer link to volatility than to economically large return predictions.
You can already inspect the information a mood score leaves out. Buzzberg's Leaderboard shows an author's recorded call count, average modeled return, win rate and comparison with the S&P 500. Market Radar brings together long and short calls, author track records, changes in attention and price context. If you find a stock there, open the underlying arguments and see who made them. In our 2026 test, the average sentiment score alone was not a reliable way to choose stocks.
Research note. Buzzberg social-factor study, prices through October 16, 2026. The 256,568 figure counts normalized mentions, not independent trades. The primary result compares daily groups of liquid, Buzzberg-mentioned stocks; forward returns use the next open and the close after 1–20 trading sessions, before fees. Longer-horizon tests omit recent signals without a complete forward price window. This is a historical association test, not a live portfolio return.